
JAS-MIN, Part 2 — Digging Deep into AWR & STATSPACK
- Radoslaw Kut
- Database , Performance , Tuning
- 25 May, 2025
Welcome to the second post in the JAS-MIN series!
In this part, we’ll dive into the most important options that shape how JAS-MIN behaves — and how to tune its sensitivity to detect what is important: Top Events, Top SQLs, correlations and anomalies.
Sensitivity
Right from the start of performance analysis, JAS-MIN gives you control over its analytical focus with two powerful switches:
-t: which adjusts the DB CPU / DB Time ratio threshold for detecting inefficient periods-m: sets threshold for detecting anomalies using MAD (Median Absolute Deviation).
These shape what JAS-MIN will consider interesting, noisy, or suspicious.
DB CPU / DB Time Ratio
./jasmin -j /path/to/jasmin_parsed_db.json -t 0.5
#or
./jasmin -d /path/to/reports -t 0.5
This setting controls how “picky” JAS-MIN is when looking for inefficient load periods — the ones that may point to performance problems not tied to CPU usage.
Let’s unpack how the ratio works and why it matters.
JAS-MIN uses the DB CPU / DB Time ratio to detect what your database was busy doing during peak times across all AWR/STATSPACK reports period.
You can think of peak periods as: “If something was going wrong with performance, it probably happened here”.
Peak periods are moments when database was most active or stressed, and the ratio helps tell if that activity was productive CPU work or waiting on something else. Ratio reflects:
- DB Time = total time spent in database calls by foreground sessions (time spent on CPU or on active waiting).
- DB CPU = part of that time spent actually using the CPU.
So:
- A ratio close to 1.0 means most of the active time was spent on CPU. CPU-bound workload is normal if your system is busy.
- A ratio lower than 1.0 (e.g. 0.4) means that sessions were spending that time on waiting - on I/O, locks, latches, etc. - possible pain
When JAS-MIN looks for important load periods, it doesn’t just look for high DB Time.
It also checks how efficient that time was by applying a threshold on the DB CPU / DB Time ratio (default: 0.666).
- If the ratio is too high, that’s often just busy CPU — not necessarily a problem, at least not when it’s not saturated.
- If the ratio is low, it may indicate performance pain, because many sessions were active but not getting CPU, they must wait on other database resources.
JAS-MIN focuses its deeper analysis on those inefficient peak periods amongst all report files by picking TOP 10 Events (based on total wait time) and TOP 10 SQLs (based on elapsed time). That’s where the most actionable insights often hide and JAS-MIN highlights this in JAS-MIN Reports.
How the Ratio Setting Influences Analysis:
As already said, you can adjust the ratio threshold with -t swittch (e.g., 0.5, 0.7) to influence what will be qualified into TOP sections::
- Lower threshold → more periods flagged as “inefficient”, broader analysis
- Higher threshold → only more extreme cases are considered, stricter focus
./jasmin -j jasmin_parsed_db.json -t 0.6 -q
...
==== ANALYZING ===
==== DBCPU/DBTime ratio analysis ====
Peaks are being analyzed based on specified ratio (default 0.666).
The ratio is beaing calculated as DB CPU / DB Time.
The lower the ratio the more sessions are waiting for resources other than CPU.
If DB CPU = 2 and DB Time = 8 it means that on AVG 8 actice sessions are working but only 2 of them are actively working on CPU.
Current ratio used to find peak periods is 0.6

Analyzing a peak in jasmin_parsed_db/awrrpt_1_452_453.html (06-Maj-25 00:00:46) for ratio: [18.10/34.80] = 0.52
Analyzing a peak in jasmin_parsed_db/awrrpt_1_476_477.html (07-Maj-25 00:00:13) for ratio: [18.90/36.10] = 0.52
Analyzing a peak in jasmin_parsed_db/awrrpt_1_500_501.html (08-Maj-25 00:00:46) for ratio: [18.90/36.50] = 0.52
Analyzing a peak in jasmin_parsed_db/awrrpt_1_524_525.html (09-Maj-25 00:00:27) for ratio: [18.20/35.30] = 0.52
Analyzing a peak in jasmin_parsed_db/awrrpt_1_548_549.html (10-Maj-25 00:00:06) for ratio: [16.90/31.60] = 0.53
Analyzing a peak in jasmin_parsed_db/awrrpt_1_572_573.html (11-Maj-25 00:00:46) for ratio: [17.20/30.20] = 0.57
Analyzing a peak in jasmin_parsed_db/awrrpt_1_596_597.html (12-Maj-25 00:00:23) for ratio: [16.90/33.70] = 0.50
Analyzing a peak in jasmin_parsed_db/awrrpt_1_620_621.html (13-Maj-25 00:00:59) for ratio: [18.60/35.60] = 0.52

==== CREATING PLOTS ===
In this example we see that with t=0.6 -> 8 reports were considered as peak periods.
After increasing t to 0.7 a much more is taken into account.
./jasmin -j jasmin_parsed_db.json -t 0.7 -q
...
==== ANALYZING ===
==== DBCPU/DBTime ratio analysis ====
Peaks are being analyzed based on specified ratio (default 0.666).
The ratio is beaing calculated as DB CPU / DB Time.
The lower the ratio the more sessions are waiting for resources other than CPU.
If DB CPU = 2 and DB Time = 8 it means that on AVG 8 actice sessions are working but only 2 of them are actively working on CPU.
Current ratio used to find peak periods is 0.7

Analyzing a peak in jasmin_parsed_db/awrrpt_1_439_440.html (05-Maj-25 11:00:30) for ratio: [13.10/19.30] = 0.68
Analyzing a peak in jasmin_parsed_db/awrrpt_1_440_441.html (05-Maj-25 12:00:36) for ratio: [12.00/17.20] = 0.70
Analyzing a peak in jasmin_parsed_db/awrrpt_1_452_453.html (06-Maj-25 00:00:46) for ratio: [18.10/34.80] = 0.52
Analyzing a peak in jasmin_parsed_db/awrrpt_1_453_454.html (06-Maj-25 01:00:58) for ratio: [13.00/18.70] = 0.70
Analyzing a peak in jasmin_parsed_db/awrrpt_1_460_461.html (06-Maj-25 08:00:39) for ratio: [14.90/21.40] = 0.70
Analyzing a peak in jasmin_parsed_db/awrrpt_1_461_462.html (06-Maj-25 09:00:46) for ratio: [14.60/22.90] = 0.64
Analyzing a peak in jasmin_parsed_db/awrrpt_1_462_463.html (06-Maj-25 10:00:52) for ratio: [12.70/19.00] = 0.67
Analyzing a peak in jasmin_parsed_db/awrrpt_1_463_464.html (06-Maj-25 11:00:57) for ratio: [12.70/18.80] = 0.68
Analyzing a peak in jasmin_parsed_db/awrrpt_1_464_465.html (06-Maj-25 12:00:03) for ratio: [14.60/21.90] = 0.67
Analyzing a peak in jasmin_parsed_db/awrrpt_1_466_467.html (06-Maj-25 14:00:15) for ratio: [13.10/19.50] = 0.67
Analyzing a peak in jasmin_parsed_db/awrrpt_1_467_468.html (06-Maj-25 15:00:21) for ratio: [13.00/19.60] = 0.66
Analyzing a peak in jasmin_parsed_db/awrrpt_1_476_477.html (07-Maj-25 00:00:13) for ratio: [18.90/36.10] = 0.52
Analyzing a peak in jasmin_parsed_db/awrrpt_1_477_478.html (07-Maj-25 01:00:26) for ratio: [14.20/22.60] = 0.63
Analyzing a peak in jasmin_parsed_db/awrrpt_1_486_487.html (07-Maj-25 10:00:21) for ratio: [13.00/19.40] = 0.67
Analyzing a peak in jasmin_parsed_db/awrrpt_1_487_488.html (07-Maj-25 11:00:27) for ratio: [14.20/21.20] = 0.67
Analyzing a peak in jasmin_parsed_db/awrrpt_1_488_489.html (07-Maj-25 12:00:33) for ratio: [12.40/18.10] = 0.69
Analyzing a peak in jasmin_parsed_db/awrrpt_1_489_490.html (07-Maj-25 13:00:38) for ratio: [13.70/20.00] = 0.68
Analyzing a peak in jasmin_parsed_db/awrrpt_1_490_491.html (07-Maj-25 14:00:44) for ratio: [13.50/19.80] = 0.68
Analyzing a peak in jasmin_parsed_db/awrrpt_1_500_501.html (08-Maj-25 00:00:46) for ratio: [18.90/36.50] = 0.52
Analyzing a peak in jasmin_parsed_db/awrrpt_1_501_502.html (08-Maj-25 01:01:00) for ratio: [14.20/22.10] = 0.64
Analyzing a peak in jasmin_parsed_db/awrrpt_1_510_511.html (08-Maj-25 10:00:58) for ratio: [14.10/20.60] = 0.68
Analyzing a peak in jasmin_parsed_db/awrrpt_1_512_513.html (08-Maj-25 12:00:10) for ratio: [12.10/17.60] = 0.69
Analyzing a peak in jasmin_parsed_db/awrrpt_1_513_514.html (08-Maj-25 13:00:16) for ratio: [14.20/20.80] = 0.68
Analyzing a peak in jasmin_parsed_db/awrrpt_1_514_515.html (08-Maj-25 14:00:23) for ratio: [13.30/19.70] = 0.68
Analyzing a peak in jasmin_parsed_db/awrrpt_1_524_525.html (09-Maj-25 00:00:27) for ratio: [18.20/35.30] = 0.52
Analyzing a peak in jasmin_parsed_db/awrrpt_1_525_526.html (09-Maj-25 01:00:40) for ratio: [13.90/21.50] = 0.65
Analyzing a peak in jasmin_parsed_db/awrrpt_1_532_533.html (09-Maj-25 08:00:25) for ratio: [16.90/25.00] = 0.68
Analyzing a peak in jasmin_parsed_db/awrrpt_1_533_534.html (09-Maj-25 09:00:32) for ratio: [14.80/21.30] = 0.69
Analyzing a peak in jasmin_parsed_db/awrrpt_1_537_538.html (09-Maj-25 13:00:57) for ratio: [13.30/19.20] = 0.69
Analyzing a peak in jasmin_parsed_db/awrrpt_1_548_549.html (10-Maj-25 00:00:06) for ratio: [16.90/31.60] = 0.53
Analyzing a peak in jasmin_parsed_db/awrrpt_1_549_550.html (10-Maj-25 01:00:17) for ratio: [12.80/19.40] = 0.66
Analyzing a peak in jasmin_parsed_db/awrrpt_1_550_551.html (10-Maj-25 02:00:23) for ratio: [11.50/17.50] = 0.66
Analyzing a peak in jasmin_parsed_db/awrrpt_1_572_573.html (11-Maj-25 00:00:46) for ratio: [17.20/30.20] = 0.57
Analyzing a peak in jasmin_parsed_db/awrrpt_1_573_574.html (11-Maj-25 01:00:56) for ratio: [13.70/20.00] = 0.68
Analyzing a peak in jasmin_parsed_db/awrrpt_1_596_597.html (12-Maj-25 00:00:23) for ratio: [16.90/33.70] = 0.50
Analyzing a peak in jasmin_parsed_db/awrrpt_1_597_598.html (12-Maj-25 01:00:35) for ratio: [13.20/20.90] = 0.63
Analyzing a peak in jasmin_parsed_db/awrrpt_1_605_606.html (12-Maj-25 09:00:25) for ratio: [14.10/21.30] = 0.66
Analyzing a peak in jasmin_parsed_db/awrrpt_1_606_607.html (12-Maj-25 10:00:31) for ratio: [13.50/20.30] = 0.67
Analyzing a peak in jasmin_parsed_db/awrrpt_1_607_608.html (12-Maj-25 11:00:37) for ratio: [13.60/20.80] = 0.65
Analyzing a peak in jasmin_parsed_db/awrrpt_1_609_610.html (12-Maj-25 13:00:50) for ratio: [13.40/19.60] = 0.68
Analyzing a peak in jasmin_parsed_db/awrrpt_1_611_612.html (12-Maj-25 15:00:03) for ratio: [13.00/18.90] = 0.69
Analyzing a peak in jasmin_parsed_db/awrrpt_1_620_621.html (13-Maj-25 00:00:59) for ratio: [18.60/35.60] = 0.52
Analyzing a peak in jasmin_parsed_db/awrrpt_1_621_622.html (13-Maj-25 01:00:11) for ratio: [14.40/23.70] = 0.61

==== CREATING PLOTS ===
-t directly affects:
- Which AWR report periods are selected for deeper analysis
- What appears in TOP Events and TOP SQLs sections
Changing DB CPU / DB Time ratio doesn’t mean that the tool will exclude less important periods from its plots, from JAS-MIN Report — they’re still visible.
By turning this single knob, you tailor JAS-MIN analytical focus — influencing how it thinks about TOP Events and TOP SQLs data: whether you’re isolating performance spikes, filtering out noise, or surfacing quieter-but-relevant anomalies.
Median Absolute Deviations
JAS-MIN doesn’t just look at peak periods — it also hunts for statistical anomalies throughout the entire AWR/STATSPACK history using a powerful technique called MAD (Median Absolute Deviation). MAD is a robust measure of variability that’s less sensitive to outliers than standard deviation. It is particularly useful when data contains outliers because it focuses on the median rather than the mean, making it more resistant to extreme values that could skew other measures of spread.
You can control MAD threshold using the -m option:
./jasmin -j /path/to/jasmin_parsed_db.json -m 3.5
#or
./jasmin -d /path/to/reports -m 3.5
It sets the threshold for how many Median Absolute Deviations (MADs) away from the median a value must be to qualify as an anomaly. In this case, we say to JAS-MIN: “Consider as anomalies values that are more than 3.5 MADs away from the median”.
It controls how strict or loose anomaly detection is.
How MAD Works in JAS-MIN
JAS-MIN checks each of the following over time:
- Foreground and background wait events (total wait time)
- SQLs (elapsed time)
- Core instance statistics
This lets JAS-MIN surface “interesting” behavior even outside traditional peak periods — patterns that don’t necessarily correlate with CPU load, but do stand out statistically.
Unlike the -t ratio, MAD doesn’t care if the system was “peaking.” It only cares about what looks weird compared to its own past.
That means it can detect:
- Odd one-off spikes
- Unusual behavior during “quiet” periods
- Anything that diverges from the norm — even if CPU is not busy
Any Event or SQL that is flagged as anomalous by MAD is eligible to appear in the TOP Events or TOP SQLs sections — even if they didn’t occur during CPU-stressed timeframes defined by the -t ratio.
This means that anomaly detection works as a complementary layer:
-tfocuses on inefficient periods-mfocuses on outliers, regardless of when they occurred
The union of both approaches ensures that JAS-MIN doesn’t miss the forest or the trees.
How MAD Threshold Influences Analysis:
Tuning the -m value:
- Lower values (e.g., 2.0) → more anomalies flagged (more noise within anomalies)
- Higher values (e.g., 15.0) → only the most dramatic spikes considered as anomalies
Where To Find MAD Info
When JAS-MIN is run in terminal it will present Anomalies in JAS-MIN Report in each section for Foreground Wait Events, Background Wait Events, SQLs, Load Profile Statistic and as combined info.
==== Statistical Computation RESULTS ===
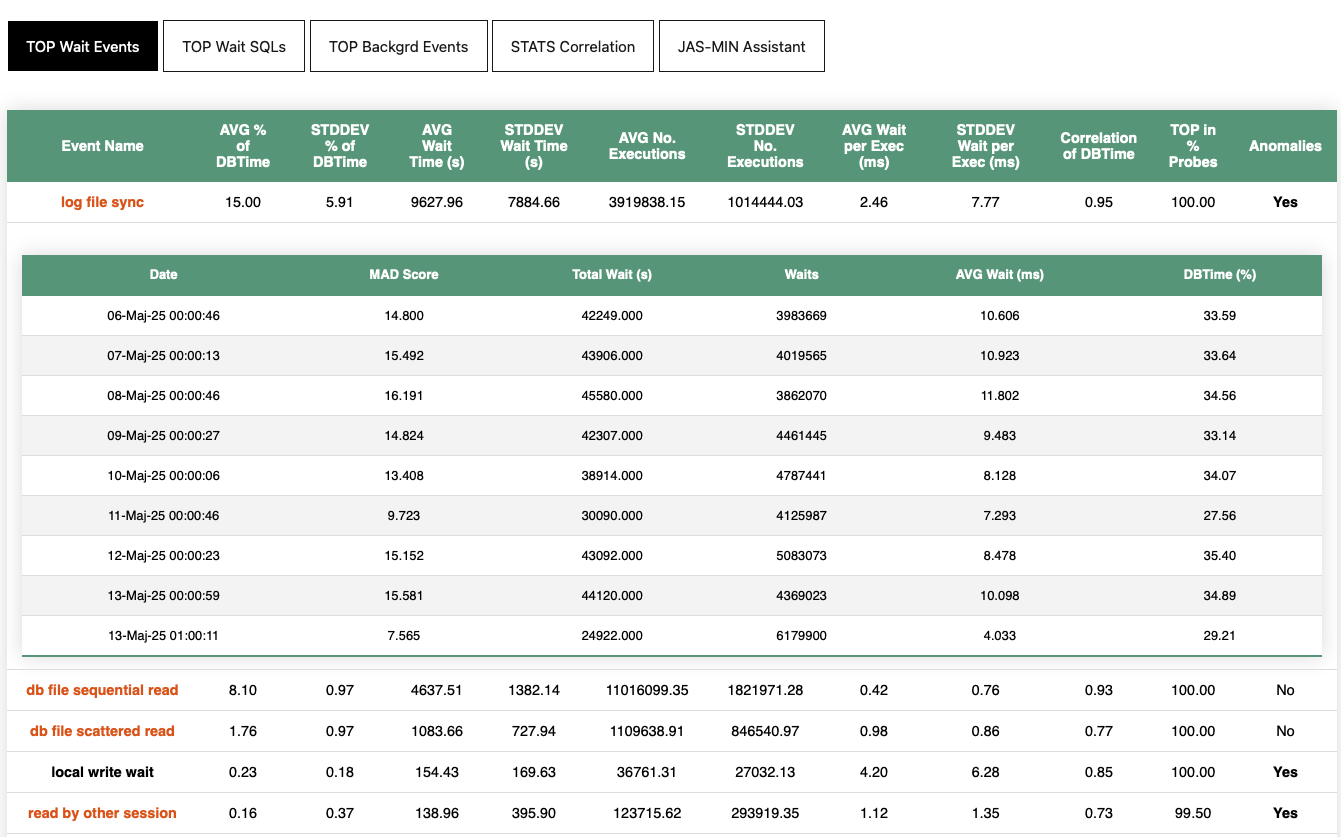
Foreground Wait Events
log file sync
--- Correlation with DB Time: 0.95 Marked as TOP in 100.00% of probes
--- AVG PCT of DB Time: 15.00% STDDEV PCT of DB Time: 5.91%
--- AVG Wait Time (s): 9627.96 STDDEV Wait Time (s): 7884.66
--- AVG No. executions: 3919838.15 STDDEV No. executions: 1014444.03
--- AVG wait/exec (ms): 2.46 STDDEV wait/exec (ms): 7.77
Detected anomalies using Median Absolute Deviation on the following dates:
+--------------------+-----------+----------------+---------+---------------+------------+
| Date | MAD Score | Total Wait (s) | Waits | AVG Wait (ms) | DBTime (%) |
+====================+===========+================+=========+===============+============+
| 06-Maj-25 00:00:46 | 14.800 | 42249.000 | 3983669 | 10.606 | 33.59 |
+--------------------+-----------+----------------+---------+---------------+------------+
| 07-Maj-25 00:00:13 | 15.492 | 43906.000 | 4019565 | 10.923 | 33.64 |
+--------------------+-----------+----------------+---------+---------------+------------+
| 08-Maj-25 00:00:46 | 16.191 | 45580.000 | 3862070 | 11.802 | 34.56 |
+--------------------+-----------+----------------+---------+---------------+------------+
| 09-Maj-25 00:00:27 | 14.824 | 42307.000 | 4461445 | 9.483 | 33.14 |
+--------------------+-----------+----------------+---------+---------------+------------+
| 10-Maj-25 00:00:06 | 13.408 | 38914.000 | 4787441 | 8.128 | 34.07 |
+--------------------+-----------+----------------+---------+---------------+------------+
For data where no anomalies are detected, JAS-MIN will explicitly state that no unusual behavior was found.
db file sequential read
		--- Correlation with DB Time: 0.93		Marked as TOP in 100.00% of probes
		--- AVG PCT of DB Time:            8.10% 	STDDEV PCT of DB Time:            0.97%
		--- AVG Wait Time (s):          4637.51 	STDDEV Wait Time (s):          1382.14
		--- AVG No. executions:     11016099.35 	STDDEV No. executions:      1821971.28
		--- AVG wait/exec (ms):            0.42 	STDDEV wait/exec (ms):            0.76

		No anomalies detected based on MAD threshold: 7
In the HTML version of the JAS-MIN Report, anomaly information appears as the last column in the TOP Sections. If an anomaly is detected, you’ll see a Yes — click it to reveal a detailed anomaly table with all the relevant information.
Summary
In this post, we explored how to steer JAS-MIN’s analytical lens using two key options:
-t— adjusts the DB CPU / DB Time ratio threshold to help pinpoint periods of inefficiency where the database may have been stuck waiting rather than working.-m— controls anomaly sensitivity using Median Absolute Deviation, allowing you to surface truly outlier behavior in waits, SQLs, and statistics.
JAS-MIN processes the full set of AWR or STATSPACK reports, but these settings influence which periods and patterns are highlighted in the final report. By tuning these switches, you control how JAS-MIN identifies performance bottlenecks, highlights anomalies, and ranks events and SQLs.
Until next time — happy tuning!