
JAS-MIN, Part 1 — Digging Deep into AWR & STATSPACK
- Radoslaw Kut
- Database , Performance , Tuning
- 14 May, 2025
It was becoming increasingly difficult to say why and for what purpose what was happening was happening; and worse still — what exactly was actually happening at all.
- Black Oceans - Jacek Dukaj
Welcome to the first installment of a multi-part blog series on JAS-MIN: JSON AWR/STATSPACK Mining Tool.
What is JAS-MIN?
     ██╗ █████╗ ███████╗      ███╗   ███╗██╗███╗   ██╗
     ██║██╔══██╗██╔════╝      ████╗ ████║██║████╗  ██║
     ██║███████║███████╗█████╗██╔████╔██║██║██╔██╗ ██║
██   ██║██╔══██║╚════██║╚════╝██║╚██╔╝██║██║██║╚██╗██║
╚█████╔╝██║  ██║███████║      ██║ ╚═╝ ██║██║██║ ╚████║
 ╚════╝ ╚═╝  ╚═╝╚══════╝      ╚═╝     ╚═╝╚═╝╚═╝  ╚═══╝
JAS-MIN is an open-source, CLI-based Rust-powered tool for community that:
- Efficiently parses Oracle AWR (.html) and STATSPACK (.txt) reports
- Converts them into single clean, structured JSON
- Generates interactive HTML-powered report with findings, plots and dashboards
- Detects important from the performance point of view patterns, correlations, anomalies
- Aims to simplify understanding database performance profile and spot “things”
- Lets you chat about database performance and it’s behaviour via optional AI Assistance
Whether you’re a DBA, performance analyst, or a DEV with a hunch, JAS-MIN helps you turn raw report files into well structured, graphically represented data, summarizations, conclusions, correlations and explainable insights.
You will find JAS-MIN on GitHub →
Why Does It Exist?
Mainly because the idea of having such a tool has been on our minds for years, together with Kamil Stawiarski. Kamil put the first bricks on the tool, which actually became very useful for us during our job and tasks, and this is how it started to evolve into something even more useful and which could be shared with Oracle community.
AWR and STATSPACK reports are incredibly valuable but extremely verbose. A single AWR/STATSPACK report lets you understand what is happening under the hood of a database, revealing the story behind wait events, SQL performance, and system metrics in some period of time.
Increasing the time range within a single report gives you a general insight into what happened, but you lose shorter events, spikes and important anomalies.
To enhance insight resolution, multiple snapshots and multiple reports can be generated. But if you have plenty of those, and you’re trying to catch patterns, make comparisons or detect deviations across many AWR/STATSPACK reports - well, they weren’t designed for humans to enjoy reading. Just you, a wall of numbers, and a slowly cooling coffee.
JAS-MIN goal is to change that.
Instead of manually combing through report files, JAS-MIN can parse hundreds of AWR and STATSPACK reports to present one, main, human-readable report, visualysing performance statistics, making it possible to deep dive in database behavior. It also integrates with modern LLMs, allowing you to use built-in “AI Assistant” chat approach in order to talk with it about your database behaviour without publishing full AWR/STATSPACK reports data to the public services.
Features Overview
This tool is in active development, ideas and feautures are evolving. As for now it:
- Efficently parses entire directories of
.txtor.htmlreports, turning them into JSON file - Is CLI-friendly
- Creates JAS-MIN Report (CLI or HTML) — a core tool for understanding the overall performance profile
- Uses Pearson Correlation between DB Time and Wait Events, SQL stats, and system statistics, highlighting key performance relationships.
- Detects anomalies using MAD (Median Absolute Deviation)
- Supports optional AI Assistant
Quickstart
Assuming that you have Rust installed on your system:
git clone https://github.com/ora600pl/jas-min.git
cd jas-min
cargo build --release
check the ouput. If there are any missing packages on your systems, install them and redo.
Now, let’s use JAS-MIN to parse entire folder in which .txt or .html report files are:
./jas-min -d /path/to/reports
you should get the ouput conating info about steps which JAS-MIN is going through to produce the output:
JAS-MIN v0.4.3 (Running with parallel degree: 4)
==== PARSING JSON DATA ===
...
==== ANALYZING ===
==== DBCPU/DBTime ratio analysis ====
Peaks are being analyzed based on specified ratio (default 0.666).
The ratio is beaing calculated as DB CPU / DB Time.
The lower the ratio the more sessions are waiting for resources other than CPU.
If DB CPU = 2 and DB Time = 8 it means that on AVG 8 actice sessions are working but only 2 of them are actively working on CPU.
Current ratio used to find peak periods is 0.666
...
Analyzing a peak in path/to/reports/awrrpt_1_452_453.html (06-04-25 00:00:46) for ratio: [18.10/34.80] = 0.52
Analyzing a peak in path/to/reports/awrrpt_1_461_462.html (06-04-25 09:00:46) for ratio: [14.60/22.90] = 0.64
Analyzing a peak in path/to/reports/awrrpt_1_467_468.html (06-04-25 15:00:21) for ratio: [13.00/19.60] = 0.66
Analyzing a peak in path/to/reports/awrrpt_1_476_477.html (07-04-25 00:00:13) for ratio: [18.90/36.10] = 0.52
Analyzing a peak in path/to/reports/awrrpt_1_477_478.html (07-04-25 01:00:26) for ratio: [14.20/22.60] = 0.63
Analyzing a peak in path/to/reports/awrrpt_1_500_501.html (08-04-25 00:00:46) for ratio: [18.90/36.50] = 0.52
Analyzing a peak in path/to/reports/awrrpt_1_501_502.html (08-04-25 01:01:00) for ratio: [14.20/22.10] = 0.64
....

==== CREATING PLOTS ===
Saved plots for Foreground events to 'path/to/reports.html_reports/fg_*'
Saved plots for Background events to 'path/to/reports.html_reports/bg_*'

==== PREPARING RESULTS ===
Foreground Wait Events
Background Wait Events
TOP SQLs by Elapsed time (SQL_ID or OLD_HASH_VALUE presented)
Statistics
Generating Plots
==== Statistical Computation RESULTS ===
....
==== DONE ===
JAS-MIN Report saved to: path/to/reports.html_reports/jasmin_reports.html
If you run JAS-MIN without -q - not in quite mode (which is default) you should see JAS-MIN Report on terminal. It should also autamatically open HTML based JAS-MIN Report, where you can start to dig and shovel performance informations about your Oracle Database.
Output Example
JAS-MIN Report consists of few sections.
Database Instance info bar.
It holds essential metadata such as:
- DB ID: Unique database identifier.
- Platform: OS and architecture (e.g., Linux x86 64-bit).
- Release: Oracle DB version.
- Startup Time: When the instance was last started.
- RAC: Whether the DB is part of a Real Application Cluster.
- Instance Number, CPUs, Cores, Sockets, Memory (G): Basic hardware layout.
- Snap range: The time window this AWR snapshot series covers. It intentionally does not include the database name, in case the report is shared externally.
TOP Buttons Section
Beneath the metadata bar, you’ll find several buttons that provide quick access to core report TOP sections, allowing you to investigate top wait events, top SQL statements, instance statistics, and more.
- TOP Wait Events – most impactful foreground wait events.
- TOP Wait SQLs – SQL statements with the highest wait contribution.
- TOP Backgrd Events – background wait events which were marked as important.
- STATS Correlation – important relationship of DB Time and instance statistics
- JAS-MIN Assistant – if enabled, chat with JAS-MIN AI Assistant.
Clicking each button reveals the corresponding section. It may open an interactive table or a dedicated subpage with additional plots and insights.
I’ll cover each of these “buttons” in more detail in the next parts of the JAS-MIN blog series, as they can lead to important and valuable conclusions.
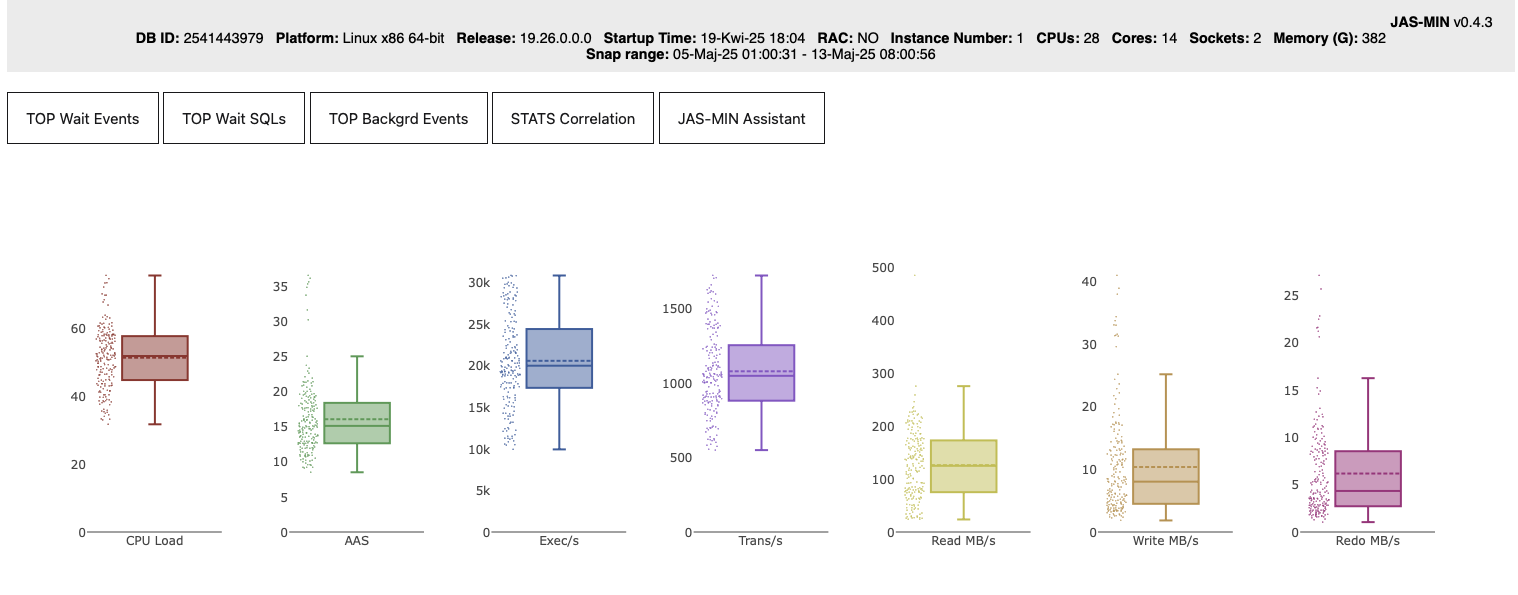
Highlight Section
The summary plots below TOP Buttons section provide instance behavior highlights — quick-glance statistical summaries of key performance metrics and load profile information across the entire AWR/STATSPACK snapshot range:
- CPU Load – Host CPU utilization.
- AAS – Average Active Sessions across snaps range.
- Exec/s - Executions per second across snaps range
- Trans/s - Transactions per second acress snaps range
- Read MB/s / Write MB/s – physical I/O rates.
- Redo MB/s – redo log generation intensity.
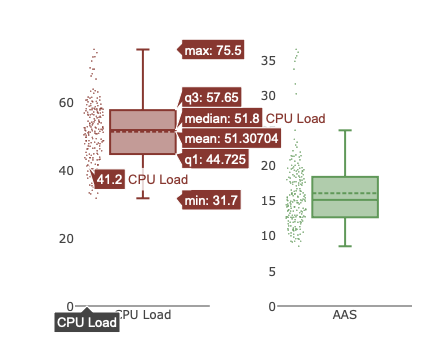
After hovering a pointer on each box plot, you will see more detailed info about statistics (e.g. mean, median, quartiles, outliers, etc.) and probes distribution (a dot cloud: every point represents a snapshot)
Interactive Plot Section
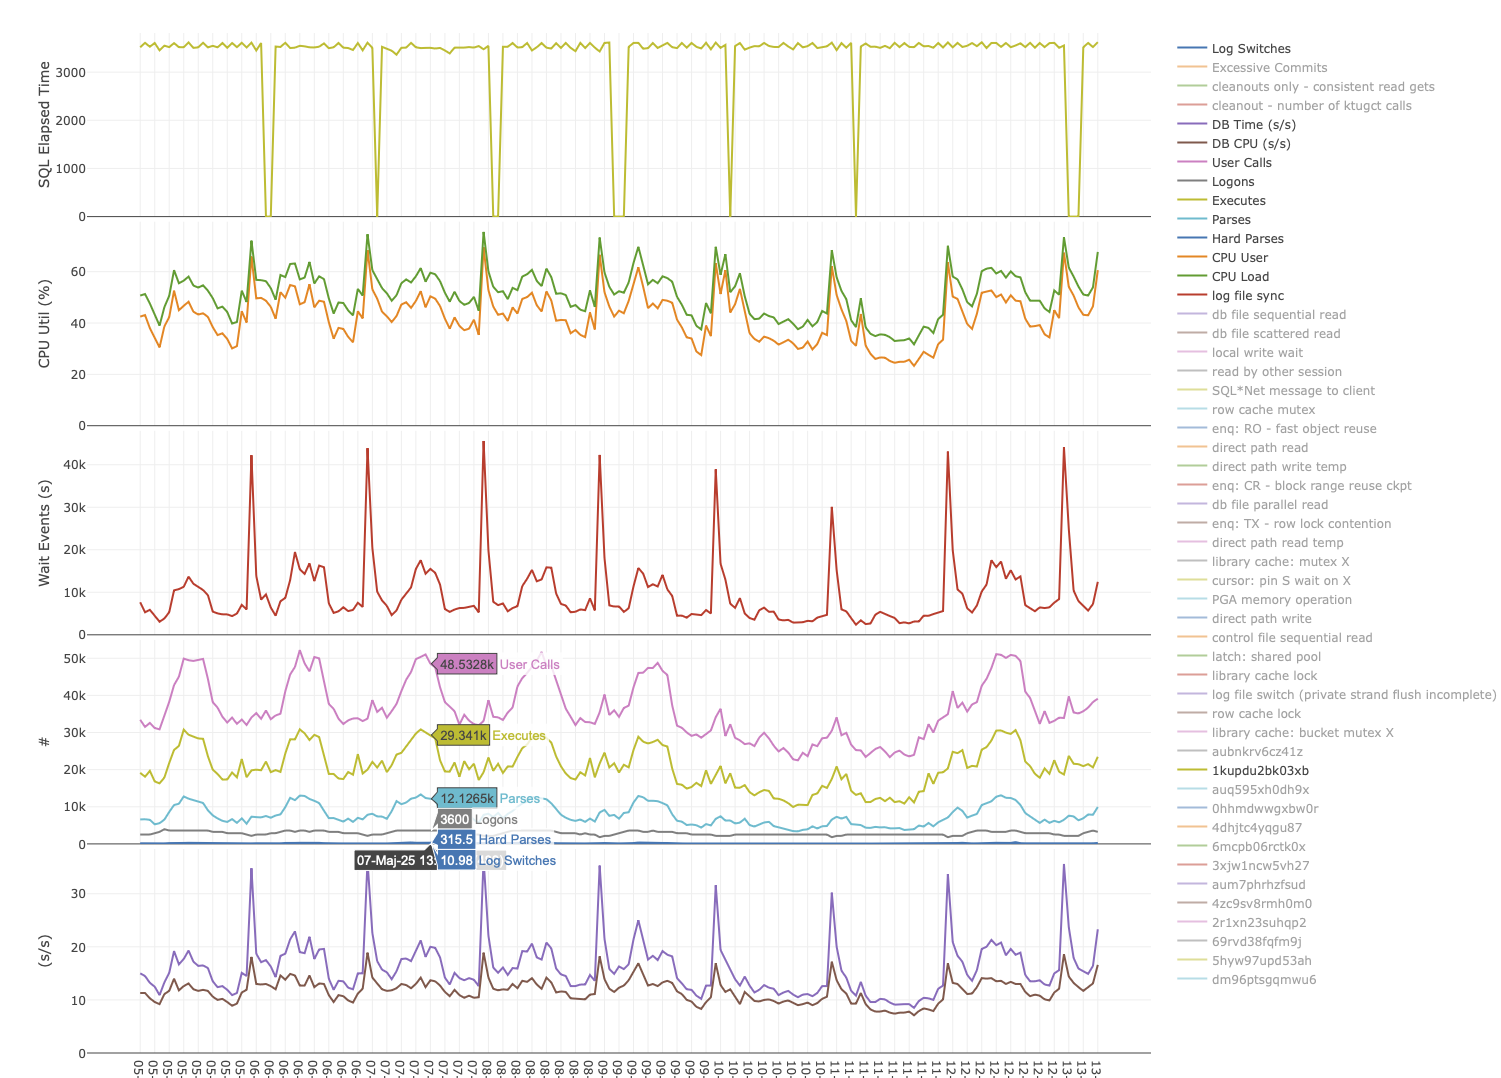 This section provides a visual heartbeat of database performance investigations — great for profiling, pattern recognition, comparisons, and deep diving. For now - just play with it! Each plot shows traces from different categories, going from bottom: DBTime and DB CPU, Instance Load Metrics, Wait Events, Host CPU Util (System and User load), SQLs.
You can reveal or hide traces using the legend on the right, zoom into specific time ranges, and explore the data interactively. It’s intuitive :)
What’s Next?
I find JAS-MIN already usable for real-world workloads — but please expect bugs, edge cases, and occasional weirdness. Feedback, PRs, and test cases are very welcome.
In Part 2, I’ll walk through some of JAS-MIN’s options that influence how it behaves and define its sensitivity. We’ll also begin exploring the interactive sections in more detail.
Stay safe.